Support from readers like you keeps The Journal open.
You are visiting us because we have something you value. Independent, unbiased news that tells the truth. Advertising revenue goes some way to support our mission, but this year it has not been enough.
If you've seen value in our reporting, please contribute what you can, so we can continue to produce accurate and meaningful journalism. For everyone who needs it.
DURING THE DRIVE home from work, American writer Danny Rubin found himself listening to NPR (US talk radio).
On the programme, the host talked about President Obama’s speech on the National Security Agency, in which the president, in a nutshell, said he will reform the NSA but not stop its collection of metadata.
He pulled into his driveway, clicked off the radio and thought, “Ya know, I feel like I’ve been listening to NPR more now than I used to, which was basically zero.”
If I had to predict my relationship with talk radio over the long haul, here’s my best guess:
Come to think of it, we can describe much of our lives in simple line graphs, he says.
Which means this line graph is all over the place:
At least family life remains consistent (after our teens):
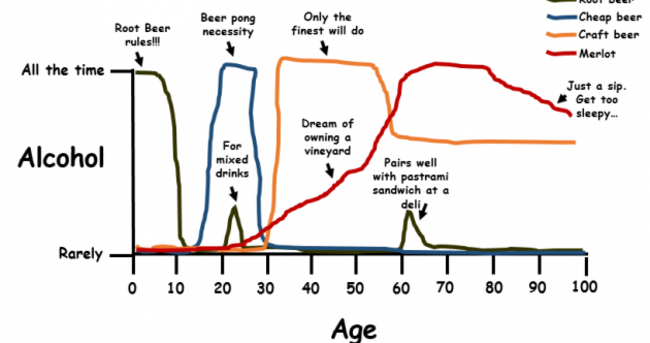
When it comes to drinking, the line graph gets a little more colourful:
Our careers also take a toll:
Advertisement
That’s why, when life gets too crazy, we need to curl up with a sure thing:
Children’s programming always lightens the mood too:
Even at our lowest, may we never do this (except once):
Still, plenty of life’s greatest truths have no timeline at all.
What’s true happiness?
Let’s try again.
Still following this blog post? Remarkable!
What graph do you agree with most? Tell us in the comments section.
Danny Rubin is the creator and writer of News To Live By, a blog that highlights the career advice ‘hidden’ in the day’s top stories. In Danny’s columns, he shows how any news story can actually make us better at living. Follow the blog @NewsToLiveBy or subscribe to the e-newsletter.
Readers like you are keeping these stories free for everyone...
A mix of advertising and supporting contributions helps keep paywalls away from valuable information like this article.
Over 5,000 readers like you have already stepped up and support us with a monthly payment or a once-off donation.
Two big errors:
- The drinking graph implies that you basically give up drink for an entire year around the age of 29.
- The cartoon-watching graph takes absolutely no account of the huge surge in cartoon enjoyment during one’s college years.
Here we go again: The Dáil speaking rights row has blown up again
39 mins ago
8.2k
71
Job Cuts
TikTok workers in Dublin to lose jobs in latest redundancies to hit the social media firm
1 hr ago
6.2k
Russia
Trump baselessly accuses Ukraine of starting the war and claims Zelenskyy is a dictator
Updated
19 Feb
53.2k
318
Your Cookies. Your Choice.
Cookies help provide our news service while also enabling the advertising needed to fund this work.
We categorise cookies as Necessary, Performance (used to analyse the site performance) and Targeting (used to target advertising which helps us keep this service free).
We and our 148 partners store and access personal data, like browsing data or unique identifiers, on your device. Selecting Accept All enables tracking technologies to support the purposes shown under we and our partners process data to provide. If trackers are disabled, some content and ads you see may not be as relevant to you. You can resurface this menu to change your choices or withdraw consent at any time by clicking the Cookie Preferences link on the bottom of the webpage .Your choices will have effect within our Website. For more details, refer to our Privacy Policy.
We and our vendors process data for the following purposes:
Use precise geolocation data. Actively scan device characteristics for identification. Store and/or access information on a device. Personalised advertising and content, advertising and content measurement, audience research and services development.
Cookies Preference Centre
We process your data to deliver content or advertisements and measure the delivery of such content or advertisements to extract insights about our website. We share this information with our partners on the basis of consent. You may exercise your right to consent, based on a specific purpose below or at a partner level in the link under each purpose. Some vendors may process your data based on their legitimate interests, which does not require your consent. You cannot object to tracking technologies placed to ensure security, prevent fraud, fix errors, or deliver and present advertising and content, and precise geolocation data and active scanning of device characteristics for identification may be used to support this purpose. This exception does not apply to targeted advertising. These choices will be signaled to our vendors participating in the Transparency and Consent Framework.
Manage Consent Preferences
Necessary Cookies
Always Active
These cookies are necessary for the website to function and cannot be switched off in our systems. They are usually only set in response to actions made by you which amount to a request for services, such as setting your privacy preferences, logging in or filling in forms. You can set your browser to block or alert you about these cookies, but some parts of the site will not then work.
Targeting Cookies
These cookies may be set through our site by our advertising partners. They may be used by those companies to build a profile of your interests and show you relevant adverts on other sites. They do not store directly personal information, but are based on uniquely identifying your browser and internet device. If you do not allow these cookies, you will experience less targeted advertising.
Functional Cookies
These cookies enable the website to provide enhanced functionality and personalisation. They may be set by us or by third party providers whose services we have added to our pages. If you do not allow these cookies then these services may not function properly.
Performance Cookies
These cookies allow us to count visits and traffic sources so we can measure and improve the performance of our site. They help us to know which pages are the most and least popular and see how visitors move around the site. All information these cookies collect is aggregated and therefore anonymous. If you do not allow these cookies we will not be able to monitor our performance.
Store and/or access information on a device 102 partners can use this purpose
Cookies, device or similar online identifiers (e.g. login-based identifiers, randomly assigned identifiers, network based identifiers) together with other information (e.g. browser type and information, language, screen size, supported technologies etc.) can be stored or read on your device to recognise it each time it connects to an app or to a website, for one or several of the purposes presented here.
Personalised advertising and content, advertising and content measurement, audience research and services development 133 partners can use this purpose
Use limited data to select advertising 103 partners can use this purpose
Advertising presented to you on this service can be based on limited data, such as the website or app you are using, your non-precise location, your device type or which content you are (or have been) interacting with (for example, to limit the number of times an ad is presented to you).
Create profiles for personalised advertising 75 partners can use this purpose
Information about your activity on this service (such as forms you submit, content you look at) can be stored and combined with other information about you (for example, information from your previous activity on this service and other websites or apps) or similar users. This is then used to build or improve a profile about you (that might include possible interests and personal aspects). Your profile can be used (also later) to present advertising that appears more relevant based on your possible interests by this and other entities.
Use profiles to select personalised advertising 74 partners can use this purpose
Advertising presented to you on this service can be based on your advertising profiles, which can reflect your activity on this service or other websites or apps (like the forms you submit, content you look at), possible interests and personal aspects.
Create profiles to personalise content 36 partners can use this purpose
Information about your activity on this service (for instance, forms you submit, non-advertising content you look at) can be stored and combined with other information about you (such as your previous activity on this service or other websites or apps) or similar users. This is then used to build or improve a profile about you (which might for example include possible interests and personal aspects). Your profile can be used (also later) to present content that appears more relevant based on your possible interests, such as by adapting the order in which content is shown to you, so that it is even easier for you to find content that matches your interests.
Use profiles to select personalised content 32 partners can use this purpose
Content presented to you on this service can be based on your content personalisation profiles, which can reflect your activity on this or other services (for instance, the forms you submit, content you look at), possible interests and personal aspects. This can for example be used to adapt the order in which content is shown to you, so that it is even easier for you to find (non-advertising) content that matches your interests.
Measure advertising performance 124 partners can use this purpose
Information regarding which advertising is presented to you and how you interact with it can be used to determine how well an advert has worked for you or other users and whether the goals of the advertising were reached. For instance, whether you saw an ad, whether you clicked on it, whether it led you to buy a product or visit a website, etc. This is very helpful to understand the relevance of advertising campaigns.
Measure content performance 59 partners can use this purpose
Information regarding which content is presented to you and how you interact with it can be used to determine whether the (non-advertising) content e.g. reached its intended audience and matched your interests. For instance, whether you read an article, watch a video, listen to a podcast or look at a product description, how long you spent on this service and the web pages you visit etc. This is very helpful to understand the relevance of (non-advertising) content that is shown to you.
Understand audiences through statistics or combinations of data from different sources 72 partners can use this purpose
Reports can be generated based on the combination of data sets (like user profiles, statistics, market research, analytics data) regarding your interactions and those of other users with advertising or (non-advertising) content to identify common characteristics (for instance, to determine which target audiences are more receptive to an ad campaign or to certain contents).
Develop and improve services 79 partners can use this purpose
Information about your activity on this service, such as your interaction with ads or content, can be very helpful to improve products and services and to build new products and services based on user interactions, the type of audience, etc. This specific purpose does not include the development or improvement of user profiles and identifiers.
Use limited data to select content 37 partners can use this purpose
Content presented to you on this service can be based on limited data, such as the website or app you are using, your non-precise location, your device type, or which content you are (or have been) interacting with (for example, to limit the number of times a video or an article is presented to you).
Use precise geolocation data 42 partners can use this special feature
With your acceptance, your precise location (within a radius of less than 500 metres) may be used in support of the purposes explained in this notice.
Actively scan device characteristics for identification 24 partners can use this special feature
With your acceptance, certain characteristics specific to your device might be requested and used to distinguish it from other devices (such as the installed fonts or plugins, the resolution of your screen) in support of the purposes explained in this notice.
Ensure security, prevent and detect fraud, and fix errors 82 partners can use this special purpose
Always Active
Your data can be used to monitor for and prevent unusual and possibly fraudulent activity (for example, regarding advertising, ad clicks by bots), and ensure systems and processes work properly and securely. It can also be used to correct any problems you, the publisher or the advertiser may encounter in the delivery of content and ads and in your interaction with them.
Deliver and present advertising and content 92 partners can use this special purpose
Always Active
Certain information (like an IP address or device capabilities) is used to ensure the technical compatibility of the content or advertising, and to facilitate the transmission of the content or ad to your device.
Match and combine data from other data sources 65 partners can use this feature
Always Active
Information about your activity on this service may be matched and combined with other information relating to you and originating from various sources (for instance your activity on a separate online service, your use of a loyalty card in-store, or your answers to a survey), in support of the purposes explained in this notice.
Link different devices 48 partners can use this feature
Always Active
In support of the purposes explained in this notice, your device might be considered as likely linked to other devices that belong to you or your household (for instance because you are logged in to the same service on both your phone and your computer, or because you may use the same Internet connection on both devices).
Identify devices based on information transmitted automatically 81 partners can use this feature
Always Active
Your device might be distinguished from other devices based on information it automatically sends when accessing the Internet (for instance, the IP address of your Internet connection or the type of browser you are using) in support of the purposes exposed in this notice.
Save and communicate privacy choices 60 partners can use this special purpose
Always Active
The choices you make regarding the purposes and entities listed in this notice are saved and made available to those entities in the form of digital signals (such as a string of characters). This is necessary in order to enable both this service and those entities to respect such choices.


have your say