Advertisement

We need your help now

Support from readers like you keeps The Journal open.

You are visiting us because we have something you value. Independent, unbiased news that tells the truth. Advertising revenue goes some way to support our mission, but this year it has not been enough.

If you've seen value in our reporting, please contribute what you can, so we can continue to produce accurate and meaningful journalism. For everyone who needs it.
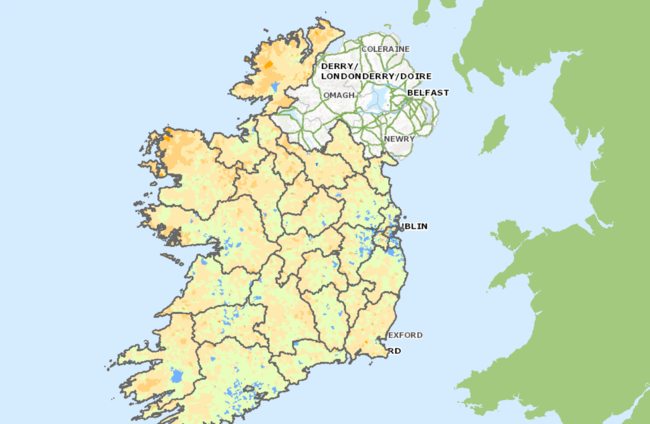
Pobal Map (Deprivation)

Ireland has only recovered by 41% from the recession

The 2016 Deprivation Index, which is deemed to be a more detailed view of how the economy is performing, was published yesterday.

CLAIMS THAT IRELAND has already bounced back from the recession have been contradicted by the results of a study that examines the rate and severity of deprivation across the country.

The co-author of the same study also said that data documenting levels of deprivation has shown that the locations of deprived and affluent areas haven’t changed – and that it’s partly due to the housing crisis.

“Ballymun is still Ballymun, and Foxrock is still Foxrock,” Trutz Haase said at the launch of his co-authored research yesterday.

“It’s effectively the housing market that guarantees that this is the case because the middle class are obviously willing to spend that fair bit extra so that they can afford to move back to the suburbs where they grew up with good schools, good health services and so on and so forth.”

The Deprivation Index is the result of examining specific information gathered as part of Census 2016, including rates of low education, adult dependency, rented accommodation, lone parents and unemployment.

The authors of the index, Trutz Haase and Jonathan Pratschke, measured deprivation by examining a person’s attributes, possessions and opportunities and the relationship between the three.

Pooling together those categories, the study reached a set of criteria against which to measure the health of the Irish economy, and which areas around the country were worst and least affected.

Here’s a graph representing deprivation data for 2006 (navy), 2011 (pink) and 2016 (green):

Table three deprivation index 2016 Pobal HP Deprivation Index 2016 Pobal HP Deprivation Index

Between 2006 and 2011, during the first years of the recession, the graph moved to the left, which represents an increase in the rate of deprivation.

The latest 2016 Census results have shown that there’s been another shift towards the right as Ireland recovers from austerity and economic hardship, but that recovery is worth 41%.

Although that’s just a different way of framing Ireland’s recovery, it’s likely to be a more accurate portrayal of how Ireland’s economic performance affects its population.

Unemployment by itself, for example, is a bad indicator of deprivation as it doesn’t capture the number of people who have emigrated due to a lack of jobs in their area, or the quality of jobs.

The usual measurement for the health of a country’s economy is the Gross Domestic Product, or GDP, which measures the value of goods and services over a year.

But this has been criticised as a blunt tool for measuring something so complex. This was illustrated after Ireland’s GDP showed the economy had expanded by 26% – an outlandish figure that international experts mockingly dubbed “leprechaun economics”.

How to find your area

Using Pobal Maps, you can enter your local area and find out whether it’s classed as affluent (blue) or deprived (red).

On the map below, you can see that most areas that are disadvantaged are located in Sligo, Mayo, Donegal Limerick and areas along the border with the North.

To view your area’s stats, you have to choose the administrative boundary (such as local authority or county), and the Pobal Deprivation year you’re looking to see.

Then you can either zoom in on a specific area, or search your home town to see how it fares. In the examples below, taken from two areas in Dublin city, you can see how to regions right next to each other scored very differently in all criteria.

Screenshot 2017-11-09 at 19.48.28 Pobal Deprivation Index 2016 Pobal Deprivation Index 2016

Screenshot 2017-11-09 at 19.48.49 Pobal Deprivation Index 2016 Pobal Deprivation Index 2016

In the “very affluent” North Dock B (first image), its population of 200 have a lone parent ratio of 11%, compared to North Dock C’s ratio of 77%.

The proportion of people with only a primary school education is 1% of North Dock B, while in North Dock C, it’s over 50%.

Deprivation’s impact

The health impact of living in deprived areas was mentioned as one negative impact at the report’s launch.

It has an impact on where doctors and dentists locate, which in turn has an impact on the choice people have to go seek medical help, according to Haase.

“We geo-coded all the dentists, and if you take the more affluent areas, the number of dentists per population is more than twice as high as the other half.”

This had an impact on the life expectancy of people living in deprived areas, who usually live several years less than average.

“These are the differences which impacts how quickly you get to hospital.”

Read: Small towns ‘hit hardest’ in the past 10 years, Dublin least affected

Read: New stats reveal Limerick has some of Ireland’s most disadvantaged areas

Readers like you are keeping these stories free for everyone...
A mix of advertising and supporting contributions helps keep paywalls away from valuable information like this article. Over 5,000 readers like you have already stepped up and support us with a monthly payment or a once-off donation.

Author
Gráinne Ní Aodha
View 87 comments
Close
87 Comments
This is YOUR comments community. Stay civil, stay constructive, stay on topic. Please familiarise yourself with our comments policy here before taking part.
Leave a Comment
    Submit a report
    Please help us understand how this comment violates our community guidelines.
    Thank you for the feedback
    Your feedback has been sent to our team for review.

    Leave a commentcancel

     
    JournalTv
    News in 60 seconds