Advertisement

We need your help now

Support from readers like you keeps The Journal open.

You are visiting us because we have something you value. Independent, unbiased news that tells the truth. Advertising revenue goes some way to support our mission, but this year it has not been enough.

If you've seen value in our reporting, please contribute what you can, so we can continue to produce accurate and meaningful journalism. For everyone who needs it.
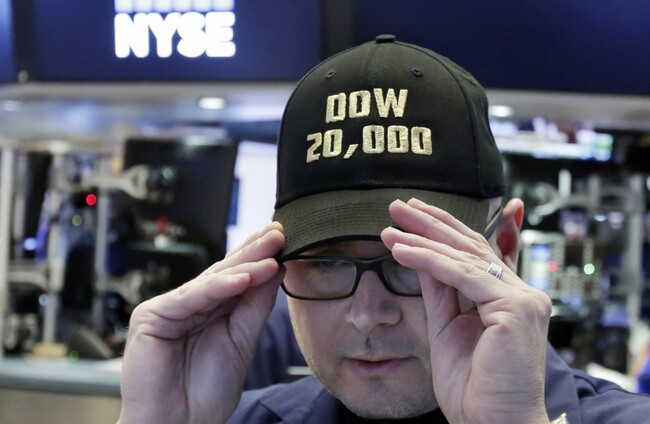
This man working on Wall Street got a special baseball cap to mark the milestone Richard Drew/AP

The Dow Jones hit over 20,000 for the first time this week - but what does that mean?

There were big celebrations on Wall Street.

THE DOW JONES industrial average, which shows the average value of 30 large industrial stocks in the US, closed above 20,000 points for the first time earlier this week.

It hit the milestone figure on Wednesday and was met with celebrations among traders on Wall Street.

But what exactly does it mean?

Q. Ok, first things first: what exactly does the Dow Jones industrial average measure?

A. The Dow Jones industrial average is calculated using the prices of 30 large, or blue chip stocks from various US industries. It’s been around since 1896, when it started out with 12 companies, one of which was General Electric, which is still in the index.

Q. When did the Dow first close above 10,000?

A. On 29 March, 1999, almost 18 years ago.

Q: So 20,000 is a big milestone? 

A: Yes, for Wall Street.

Financial Markets Wall Street Richard Drew / PA Richard Drew / PA / PA

Q: Was this anything to do with Donald Trump? 

A: It depends on how you see it. The US economy has been doing well for some time now, and this had been widely predicted.

However some people – including Kellyanne Conway, a key advisor to Donald Trump – would see the inauguration of the US president as giving a significant boost to the economy.

Q. Can the US stock market keep going higher?

A. The Dow has more than tripled from its low point during the recession seven years ago. Some experts have been surprised the market has continued to rise so much in recent months, particularly since corporate profits have been mostly shrinking over the last year and a half, but that doesn’t mean the market can’t go any higher. The US market is now in the second-longest bull run since World War II, following the rally of 1990-2002.

The election of Donald Trump as US president in November has made investors more optimistic about growth in the economy and the profit potential for industries like banking and energy, which are expected to benefit from his drive to roll back regulations, lower taxes and rev up economic growth.

Q. If the market keeps setting record highs, does that mean stocks are getting expensive?

A. By some measures, yes. The long drive up in the market has sent a key barometer of how expensive stocks are above its long-term average.

A stock’s price is meant to reflect how much investors expect a company to earn in profits. If those profits grow, you’d expect the stock to rise. Sometimes, though, stock prices rise even if earnings don’t, and that’s when stocks start to look expensive relative to their historical norms.

Financial Markets Wall Street Richard Drew / PA Richard Drew / PA / PA

One widely used measure of value divides the price of the Standard & Poor’s 500 index by the annual earnings at those companies over 10 years, adjusted for inflation. That number is currently 28.7, a bit above where it was 10 years ago but far below where it was prior to the dot-com implosion of 2000-2002. Since World War II, the average ratio has been 19.

Q. So stocks have gone up a lot, what about bonds?

A. Bond prices have gone down a fair bit since the election, which has sent long-term interest rates higher.

Investors have been selling bonds because they expect that the infrastructure spending plans of Trump could lead to faster economic growth and higher inflation, both of which are bad for bonds.

Q. What about other markets around the world, how are they doing?

A. In general, not as well as the US market. In Europe, Italy’s market is up just 5.1% over the last year. France’s index has gained about half as much as the Dow has over the past year, while indexes in German and Britain lag the Dow slightly. Japan’s market is up 11.4% over the last 12 months, less than half of the Dow’s gain.

Read: How a group of hackers and traders made $100 million – using press releases

Read: Here’s what Hillary Clinton told Goldman Sachs in paid speeches, according to Wikileaks

Readers like you are keeping these stories free for everyone...
A mix of advertising and supporting contributions helps keep paywalls away from valuable information like this article. Over 5,000 readers like you have already stepped up and support us with a monthly payment or a once-off donation.

Close
40 Comments
    Submit a report
    Please help us understand how this comment violates our community guidelines.
    Thank you for the feedback
    Your feedback has been sent to our team for review.
    JournalTv
    News in 60 seconds