Advertisement

We need your help now

Support from readers like you keeps The Journal open.

You are visiting us because we have something you value. Independent, unbiased news that tells the truth. Advertising revenue goes some way to support our mission, but this year it has not been enough.

If you've seen value in our reporting, please contribute what you can, so we can continue to produce accurate and meaningful journalism. For everyone who needs it.

Debunked: A historical chart in an old IPCC report does not show that climate change is a hoax

The medieval warm period was ‘cancelled’ by the IPCC, it was claimed.

A GRAPH CHARTING temperature changes from the year 900 to 2000 has been cited as evidence that the Intergovernmental Panel on Climate Change (IPCC) is suppressing data that counters evidence supporting climate change.

However, the graph in question, published by the IPCC in 1990, is an illustrative graphic that was never intended to be an accurate representation of global temperatures.

It is instead based on a diagram to represent historically documented weather changes in central England only.

The chart, often referred to as “figure 7.1”, has been cited in blogs arguing against climate change for more than a decade, but has recently resurfaced in social media posts by Ivor Cummins, an Irish conspiracy theorist who has previously shared false information about COVID-19.

It is often used to imply that the IPCC is dishonest, or that temperature fluctuations in the past are being downplayed in order to make current warming trends appear more severe.

The IPCC is an intergovernmental body of the United Nations that elects scientists to collate and summarise research on climate change.

“In the 1990 IPCC Report they clearly showed the medieval warm period and the little ice age,” Ivor Cummins wrote on a Facebook post that has been shared more than 200 times.

“In later reports they eliminated these two factual climatic events and adopted the Mann Hockey Stick #FRAUD,” he continued.

Mann Hockey Stick graphs refer to long-term temperature charts that show significant increases in the last few years, representing higher recordings of temperatures across the globe due to climate change.

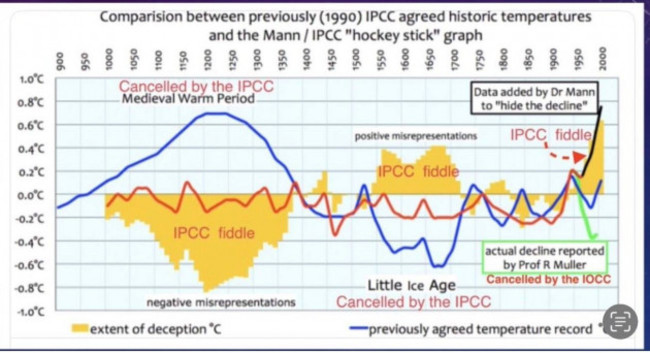
Cummins’ post is accompanied by a chart with annotations, including ones saying that the Medieval Warm Period and Little Ice Age were “Cancelled by the IPCC”, as well as shaded in areas that are marked “IPCC fiddle”.

Cancelled A misleading diagram shared online

The chart is labelled “Comparison between previously (1990) agreed historic temperatures and the Mann/IPCC ‘hockey stick’ graph”.

However, this label is misleading.

Historic temperature graph

So what is this historic temperature chart that is supposedly being suppressed?

The chart, “figure 7.1”, is taken from the scientific assessment of climate change published in the first IPCC report in 1990. Far from being suppressed, the full publication is still freely available on the IPCC website.

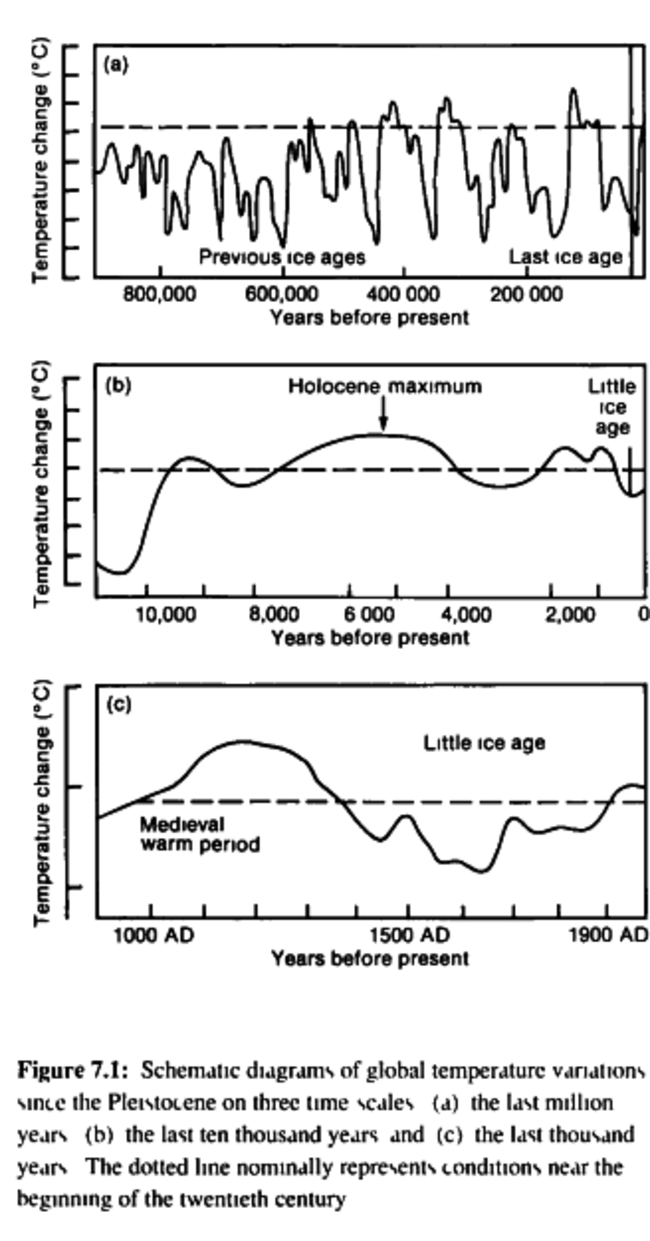
The chart is part of a series of three diagrams on page 202 of the report, the caption of which reads: “Schematic diagrams of global temperature variations since Pleistocene on three time scales.”

Figure 7.1 Figure 7.1 from the 1990 IPCC report

The chart going back a thousand years is the only one included in claims that the IPCC is suppressing information, but another two charts also go back much further, 10,000 and 800,000 years respectively.

The key term from the description is “schematic diagrams”, which means that rather than being an accurate representation of world temperatures, they are oversimplified demonstrations of a key message.

In this case, the aim is to show how the range of temperature fluctuations on Earth has narrowed since the last ice age.

Schematic diagrams are regularly used in design: rail network maps are one type that most people are familiar with.

Rather than accurately showing the path of railways, such maps instead used straight lines and evenly spaced station names to simply show the general direction of a rail line.

Dublin An example of a schematic diagram from IrishRail.ie

So was the chart in the IPCC report effectively just a doodle?

Probably not, according to a research paper called High-resolution Palaeoclimatology of the Last Millennium: a Review of Current Status and future Prospects.

The authors of that paper found that the schematic diagram in the IPCC report was actually an almost-perfect match for a similar one in a 1960s publication by HH Lamb, a well-known English climatologist.

Now that we know the source of the supposedly suppressed chart, how accurately does it represent historical global temperatures? The answer is: not at all.

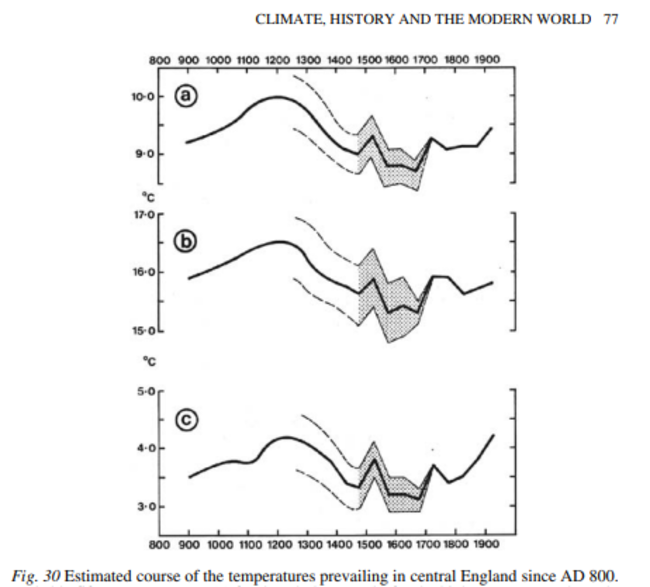
In a later book, available online, Climate, History and the Modern World, Lamb included the chart again, alongside some additional information.

The chart’s caption reads: “Fig. 30. Estimated course of the temperatures prevailing in central England since AD 800.”

Climate history A diagram in the textbook: Climate, History, and the Modern World

The chart shows estimated temperatures in England, not the entire world, and how these estimate were derived was quite unusual.

The numbers are largely an expression of how many “reports of mild or cold months
in winter and wet or dry months in summer” could be found for each decade.

An example of such a report is given as “an account roll from the medieval manor of Knightsbridge—now part of London—stating that iron for ploughs and horseshoes to an extra cost of thirty shillings was required in 1342 because of the ‘great drought’ in the summer of that year”.

Rather than being a scientific record of global temperatures, the diagram is instead an estimate of the climate in central England based on sporadic mentions in historical documents.

In other words, those historical documents were used to roughly estimate historical temperatures in central England; and then a chart of those temperatures appears to have been used by the IPCC in 1990 as a “schematic diagram” to illustrate temperature fluctuations within a range.

Decades later, the omission of this chart from recent reports is being taken as evidence that the IPCC is lying about climate change and suppressing evidence (despite the chart still being available on their website).

Claims that this chart is being suppressed are wrong, and claims that different, newer charts must be faulty give undue weight to rough estimates of historical temperatures in central England, published in the 1960s.

Furthermore, claims that this chart contradicts climate change theories are undermined by the extreme temperature increases recorded globally since the chart was first formulated — more extreme than any increases plotted on Hart’s chart for the the Medieval Warm Period.

The Journal’s FactCheck is a signatory to the International Fact-Checking Network’s Code of Principles. You can read it here. For information on how FactCheck works, what the verdicts mean, and how you can take part, check out our Reader’s Guide here. You can read about the team of editors and reporters who work on the factchecks here.

Readers like you are keeping these stories free for everyone...
It is vital that we surface facts from noise. Articles like this one brings you clarity, transparency and balance so you can make well-informed decisions. We set up FactCheck in 2016 to proactively expose false or misleading information, but to continue to deliver on this mission we need your support. Over 5,000 readers like you support us. If you can, please consider setting up a monthly payment or making a once-off donation to keep news free to everyone.

Close
JournalTv
News in 60 seconds