Advertisement

We need your help now

Support from readers like you keeps The Journal open.

You are visiting us because we have something you value. Independent, unbiased news that tells the truth. Advertising revenue goes some way to support our mission, but this year it has not been enough.

If you've seen value in our reporting, please contribute what you can, so we can continue to produce accurate and meaningful journalism. For everyone who needs it.
Number of Roman Catholic marriages reducing but it's still the most popular type of ceremony

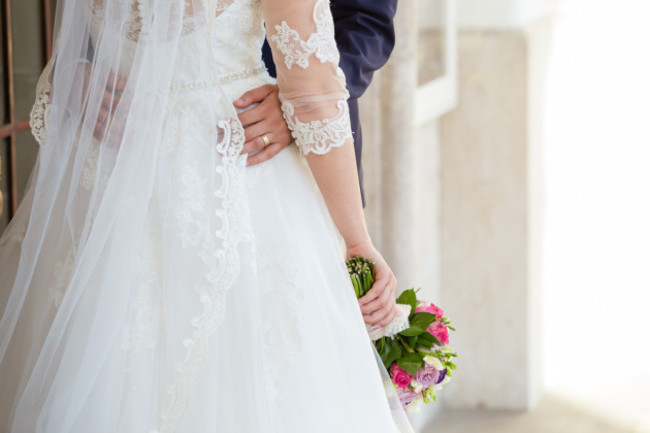
The average age of grooms in Ireland is 36, while the average age of brides is 34.

shutterstock_764938294 Shutterstock / Cristian Beck Shutterstock / Cristian Beck / Cristian Beck

MORE THAN 22,000 marriages took place in Ireland last year.

Figures released by the Central Statistics Office (CSO) today show that 21,262 opposite-sex marriages and 759 same-sex marriages took place last year.

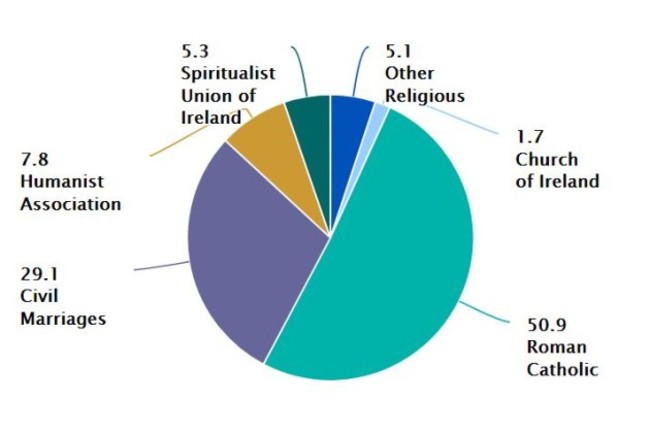
The percentage of Roman Catholic marriages has gradually decreased in recent years but this type of ceremony is still the most popular choice among opposite-sex couples, with 11,219 (52.8%) couples opting for it. Catholic ceremonies regularly accounted for over 90% of marriages in the 1990s.

Overall, 64.7% of all marriages in 2017 were religious. There were 379 (1.8%) Church of Ireland ceremonies and 64 (0.3%) Presbyterian ceremonies last year. The remaining 1,011 (4.8%) couples opted for other religious ceremonies.

marr CSO Ireland CSO Ireland

Civil marriage ceremonies were the most popular choice for non-religious marriage ceremonies, accounting for 5,890 (27.7%) of all opposite-sex marriages and over two-thirds of same-sex marriages.

The CSO said the number of couples choosing humanist and Spiritual Union of Ireland ceremonies has increased in recent years.

A humanist ceremony was the choice of 1,616 (7.6%) opposite-sex couples and 111 same-sex couples in 2017, while 1,083 (5.1%) opposite-sex couples and 76 same-sex couples opted for a Spiritual Union of Ireland ceremony.

Average age

While the average age of grooms in an opposite-sex marriage was at its highest to date in 2017, at 36.1 years, men entering same-sex marriages were older on average at 40.3 years.

The average age of brides in an opposite-sex marriage was 34.1 years in 2017, while the comparable age for brides in a same-sex marriage was 40.5 years.

The summer months of July and August were the most popular for weddings of opposite-sex couples. September was the most popular month to wed for same-sex couples. Unsurprisingly, the colder months of January and February were the least popular.

Friday and Saturday continued to be the most popular days to get married for opposite-sex couples, while Thursday and Friday were the days same-sex couples were most likely to be married. Sundays and Mondays remained the least popular days of the week to marry for all couples.

Read: ‘Not good enough’: Family of woman shot by garda killer says GSOC is not properly resourced

Read: Social workers have to develop skills to deal with allegations of historical abuse ‘on the hoof’

Readers like you are keeping these stories free for everyone...
A mix of advertising and supporting contributions helps keep paywalls away from valuable information like this article. Over 5,000 readers like you have already stepped up and support us with a monthly payment or a once-off donation.

Close
96 Comments
This is YOUR comments community. Stay civil, stay constructive, stay on topic. Please familiarise yourself with our comments policy here before taking part.
Leave a Comment
    Submit a report
    Please help us understand how this comment violates our community guidelines.
    Thank you for the feedback
    Your feedback has been sent to our team for review.

    Leave a commentcancel

     
    JournalTv
    News in 60 seconds