Advertisement

We need your help now

Support from readers like you keeps The Journal open.

You are visiting us because we have something you value. Independent, unbiased news that tells the truth. Advertising revenue goes some way to support our mission, but this year it has not been enough.

If you've seen value in our reporting, please contribute what you can, so we can continue to produce accurate and meaningful journalism. For everyone who needs it.
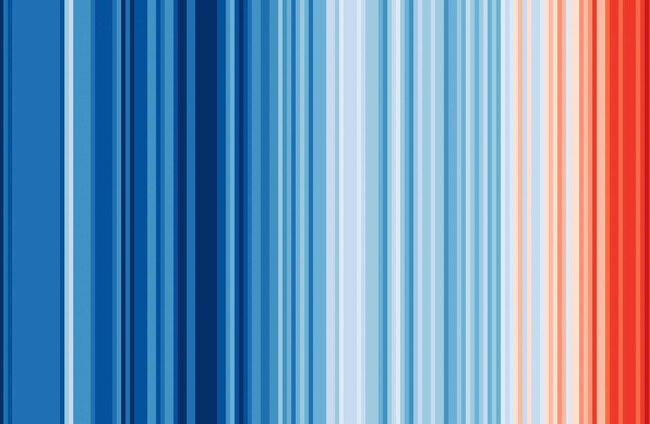
An updated version of the ‘climate stripes’ graphic showing the world warming Ed Hawkins/University of Reading/PA Images

Past eight years were hottest since records began, UN scientists confirm

The World Meteorological Organisation found the average global temperature in 2022 was about 1.15C above 1850-1900 levels.

THE PAST EIGHT years were the hottest eight on record globally according to six leading international temperature datasets, UN scientists have confirmed.

One of the six datasets is from the Met Office and University of East Anglia, which found that 2022 was another “near-record”, with the year coming in as the sixth warmest in records dating back to 1850.

The global average temperature was 1.16 degree Celsius above pre-industrial levels, making 2022 the ninth year in a row in which the global average temperature was 1 degree or more above the 19th century baseline, the Met Office said.

The University of Reading has released the latest version of the now-famous “climate stripes” graphic including 2022 using the Met Office figures, which inventor Professor Ed Hawkins said showed “stark” global warming.

Overall, the six international datasets consolidated by the UN’s World Meteorological Organisation (WMO) found the average global temperature in 2022 was about 1.15 degree above 1850-1900 levels.

The WMO said the past eight years were the eight warmest on record, fuelled by ever-rising greenhouse gas concentrations and accumulated heat.

And 2022 was the eighth consecutive year that annual global temperatures had reached at least 1 degree above pre-industrial levels in all the datasets, which each separately analyse temperature data.

Across the datasets, 2022 was assessed as being the fifth or sixth warmest year on record, despite the presence of a La Nina event – a natural climate pattern which has the effect of temporarily cooling temperatures.

But the WMO warned that the cooling impact was short-lived and would not reverse the long-term warming trend caused by greenhouse gases put into the atmosphere by human activity such as burning fossil fuels.

The likelihood of temporarily breaching the 1.5 degree temperature limit for global warming set in the international Paris Agreement to avoid the worst impacts of climate change was increasing with time, the WMO said.

Dr Colin Morice, from the Met Office, said: “2022 was another near-record year for global average temperatures, despite the slight cooling influence of La Nina: a pattern of climate variability in the tropical Pacific that typically acts to suppress global temperatures.

“Climate variability has always imparted an influence on global temperature, making some years slightly warmer or cooler than others.

“The influence of natural variability throughout the 173-year-long observed temperature record is small compared to the ongoing warming due to human-induced climate change.”

Professor Tim Osborn, of the University of East Anglia’s Climatic Research Unit, said: “Our global temperature data show that 2022 was consistent with the long-term warming of 0.2 degree per decade that we have observed over the last 50 years.

“Unless we can take action that slows this rate of warming, the world’s climate will reach 1.5 degree above pre-industrial levels within the next 15 years.”

The climate stripes created by Prof Hawkins, professor of climate science at the University of Reading, represent each year since 1850 with a consecutive vertical stripe whose colour ranges from deep blue for the coldest years to dark red for the warmest years.

The stripes are a visual representation of the world warming, with older years to the left of the graphic dominated by blue stripes, which changes to more recent years with darkening shades of red.

He said: “The data from 2022 is stark, however you look at it.

“Whether you view the figures in their raw form, or look at the data as another red line added to the climate stripes, the message is clear.

“Excess heat is building up across the planet at a rate unprecedented in the history of humanity.”

He said 2022’s stripe was the second-darkest red because of La Nina and that, as that climate pattern changed, the darkest red stripes would return.

He added: “If you think how hot 2022 was, and then realise that those 12 months will likely be one of the coolest years of the rest of our lives, I think we will regret not having acted sooner on these warnings.”

Close
17 Comments
This is YOUR comments community. Stay civil, stay constructive, stay on topic. Please familiarise yourself with our comments policy here before taking part.
Leave a Comment
    Submit a report
    Please help us understand how this comment violates our community guidelines.
    Thank you for the feedback
    Your feedback has been sent to our team for review.

    Leave a commentcancel

     
    JournalTv
    News in 60 seconds