Advertisement

We need your help now

Support from readers like you keeps The Journal open.

You are visiting us because we have something you value. Independent, unbiased news that tells the truth. Advertising revenue goes some way to support our mission, but this year it has not been enough.

If you've seen value in our reporting, please contribute what you can, so we can continue to produce accurate and meaningful journalism. For everyone who needs it.
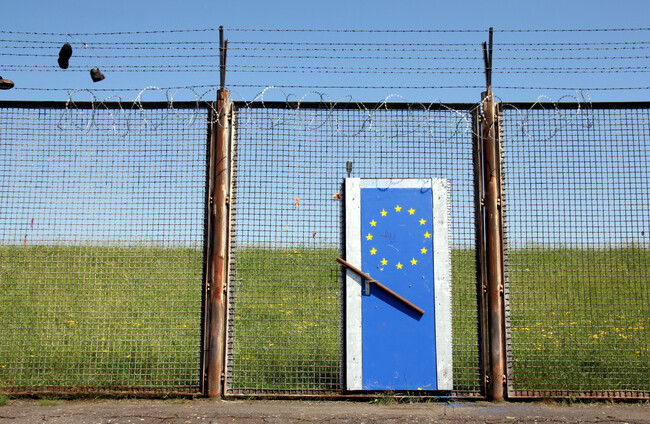
Shutterstock/Hieronymus Ukkel

FactFind: What are the migration trends into Europe?

Applications for refugee status increased dramatically after the Syrian humanitarian crisis in 2015, and dipped at the beginning of the pandemic.

WHAT ARE THE main passages and migration trends in Europe?

This is a particularly complicated question to answer as there are so different ways it could be measured: is migration counted as non-EU residents, new EU citizens, asylum seekers and refugees, estimations of illegal migrants, any non-national living in an EU country, or a combination of all of these?

Immigration figures should also be put in context of the number of people emigrating out of the EU, with net migration being the key indicator. 

Migration is influenced by a combination of economic political and social factors: with a migrant’s country offering ‘push factor’ conditions, or the country of destination offering ‘pull factors’. The economic prosperity and stability of the EU in recent years offer a considerable pull for immigrants, particularly those living in politically unstable regions.

Here are the migration trends into the EU over the past 5-6 years.

Residency

On 1 January, there were 447.3 million inhabitants living in the EU. 5% of this total, or 23 million, were non-EU citizens. 8% were born outside the EU.

For those with a valid residence permit, 38% said they sought the permit for family reasons, and 17% said they sought it for work. 

Non-EU citizens were more likely to work as cleaners, builders, and personal service and care workers than other sectors of employment; this tallies with research that shows migrants tend to take up lower-paid work, which tends to benefit ‘native’ workers.

According to EU figures, there is an average of 5 migrants per 1,000 inhabitants across the bloc as of 2019. Ireland’s rate is three times above that average, with the fourth highest proportion of non-EU migrants per 1,000 (17).

Asylum seekers and refugees

Applications for refugee status increased dramatically after the Syrian humanitarian crisis in 2015, and dipped at the beginning of the pandemic. 

There is a chance that applications for asylum in the EU will rise in the wake of the Taliban takeover of Afghanistan, but it is likely that the majority of asylum seekers will seek refuge in Afghanistan’s neighbouring countries.

Eurostat Eurostat Eurostat

This is because the majority of refugees from Africa and Asia do not come to Europe, but rather move to neighbouring countries.

The top five nationalities of first-time asylum applicants in 2020 were from Venezuela (7.3% of all first-time applications); Colombia (7%); Georgia (1.6%); Peru (1.5%) and Honduras (1.4%).

EU countries granted some sort of protection to around 280,000 people in 2020. The largest groups were from: Syria (27% of all people granted protection); Venezuela (17%) and Afghanistan (15%).

Out of the EU’s total population of 447 million people, as of 2019 its refugee population made up 0.6% of its total population. In Germany, it makes up 1.4% of its population.

The five countries with the highest proportion of refugees in its population are Lebanon (13.4%), Jordan (6.4%), Turkey (4.3%), Uganda (3.3%), and Sudan (2.5%).

Citizenship

Naturalisation rate in 2019 (1) Eurostat Eurostat

In 2019, the largest group of new EU-citizens were as follows:

  • Moroccans (66,800, of whom 84% acquired citizenship of Spain, Italy or France),
  • Albanians (41,700, 62% acquired citizenship of Italy),
  • Brits (29,800, 75% acquired citizenship of Germany, Sweden or France),
  • Syrians (29,100, 69% acquired citizenship of Sweden),
  • Turks (28,600, 57% acquired German citizenship),
  • Romanians (26,600, 60% acquired citizenship of Italy or Germany),
  • Brazilians (23 500, 73% acquired citizenship of Italy or Portugal),
  • Ukrainians (18,100, 59% acquired citizenship of Germany, Poland or Italy),
  • Algerians (18,000, 82% acquired French citizenship) and
  • Russians (16,400, 31% acquired German citizenship).

Romanians (26,600 persons), Poles (12,600) and Italians (8,700) remained the three largest groups of EU citizens acquiring citizenship of another EU member state, the same as in 2018.

In 2019, the highest naturalisation rates (the proportion of foreign residents given citizenship) were registered in Sweden (7 citizenships granted per 100 resident foreigners), Romania (4.7) and Portugal (4.4), followed by Finland (3.8), the Netherlands (3.2) and Belgium (2.9).

At the opposite end of the scale, naturalisation rates below 1 citizenship acquisition per 100 resident foreigners were recorded in Lithuania (0.2), Denmark (0.3), and Estonia, with Ireland’s and Malta’s rate at 0.9. 

Irregular migration

Eurostat frontex European Commission European Commission

In 2020, there were 125,100 “irregular” border crossings logged by Frontex, the EU’s border security agency. 

This was a 12% decrease compared to 2019, and the lowest in seven years.

There were 86,300 sea crossings in 2020, which is a decrease of 19% compared to 2019; and 38,800 land border crossings, an increase of 9% compared to 2019.

In 2020, there was an increase of 51% in crossings on the western Mediterranean (including the Atlantic route from western Africa to the Canary Islands) and an increase of 155% on the Central Mediterranean routes (40,300 and 35,700 respectively).

This work is co-funded by Journal Media and a grant programme from the European Parliament. Any opinions or conclusions expressed in this work is the author’s own. The European Parliament has no involvement in nor responsibility for the editorial content published by the project. For more information, see here.

Close
Comments
This is YOUR comments community. Stay civil, stay constructive, stay on topic. Please familiarise yourself with our comments policy here before taking part.
Leave a Comment
    Submit a report
    Please help us understand how this comment violates our community guidelines.
    Thank you for the feedback
    Your feedback has been sent to our team for review.

    Leave a commentcancel